Profiling Example
Profiling Composable Distributed Training
Composable distributed training (especially at scale) can make profiling resource utilization both more important and challenging. To address this need, FTS includes a utility that enables quick, flexible orchestration of advanced profiling combining multiple complementary PyTorch profilers.
The MemProfiler is a powerful memory profiling utility that synthesizes
numerous complementary profiling methods. As demonstrated in this example, the following profiling utilities are
integrated and simultaneously configured:
FSDP2MemTrackerhost-level memory tracking
custom memory hooks (e.g. for activation checkpoint memory tracking via
saved_tensors_hooksetc.)
The PyTorch Profiler (as well as an extended version), can also be simultaneously configured to provide a remarkably complete view of distributed training resource utilization.
Note
While this example focuses on composable distributed training,
MemProfiler can be used with any type of training session.
Profiling Artifacts
This example uses the following simple profiling configuration to enable extensive profiling of the default method (‘training_step’) using a default schedule (warmup 1 iteration, collect for 1 iteration) and produces the profiling artifacts below.
For this model_parallel example, all artifacts should be nested in the tensorboard log dir under fts_examples/
model_parallel / lightning_logs / fts_fsdp_profiling / version_{n}.
FSDP2MemTrackertracking for the collected iteration (per-rank), e.g.:./memprofiler/fsdp_mem_rank_0_training_step_2.logConsolidated memory snapshot collection entries, dumped to
.yamlby default (can also be dumped to*.pickleif preferred).Snapshot entries are provided for each profiled method, ‘start’ and ‘end’ of each iteration for each of the enabled memory tracking types.
By default, keys associated with ‘cuda’, ‘cpu’ (host-memory), and custom memory hooks are included.
The custom hooks are
saved_tensors_hooksin this case, tracking non-parameter packed bytes which is a useful proxy for memory associated with activations:./memprofiler/rank_1_memory_stats.yaml
Cuda allocator history tracking, start and end of the collected iteration (per-rank), e.g.:
./memprofiler/cuda_alloc_rank_0.training_step.2.end.picklePyTorch Profiler (extended version), according to the separately provided PyTorch Profiler configuration, e.g.:
./fit-fts_extended_pytorch_profiler-0[Strategy]ModelParallelStrategy.training_step.{epoch time}.pt.trace.json./fit-fts_extended_pytorch_profiler-0.txt
Configuration
trainer.profiler: pytorch_profiler.yaml  # enable normal PyTorch Profiler configuration
# we enable MemProfiler collection for default functions ('training_step') and schedule
# note any method decorated with @MemProfiler.memprofilable can be specified for collection
memprofiler_cfg:
    enabled: true
    cuda_allocator_history: true  # enable cuda memory snapshot/allocator history tracking
    track_fsdp_mem: true  # enable FSDP2MemTracker tracking
    fsdp_mem_track_module_depth: 3  # collect up to 3 levels of nested FSDP modules
    fsdp_mem_tracker_tabulate: true  # display FSDP2MemTracker stats in a table
    fsdp_mem_tracker_root_module: 'model'  # the root FSDP module for FSDP2MemTracker to track
Tip
For more advanced usage examples (e.g. non-default schedules, custom collection functions, etc.), see the commented
configuration options in fts_examples/model_parallel/config/profiling/memprofiler_demo.yaml.
Reviewing the Results
Running the example with the following command, we can explore the detailed resource utilization characterization we now have available!
cd ./fts_examples/model_parallel && \
python mp_examples.py fit --config config/fts_fsdp_profiling.yaml --config config/profiling/memprofiler_demo.yaml
FSDP2MemTrackertracking data for rank 0:
FSDP2 Mem Tracker Report for training_step iteration 2, rank 0
Consolidated cuda memory snapshot, custom hook (‘npp’
saved_tensors_hooksin this case) and host-level memory summary (rank0in this case):
0.training_step.2.end:
    #...
    # standard cuda memory snapshot data
    active_bytes.all.allocated: 1948350976
    active_bytes.all.current: 184830976
    active_bytes.all.freed: 1763520000
    active_bytes.all.peak: 330579456
    #...
    active_bytes.small_pool.allocated: 204683776
    ...
    # measured 6.5 MiB of non-parameter packed bytes using our custom `saved_tensors_hooks``
    npp_diff: 6815744
    npp_post_forward: 6815744
    npp_pre_forward: 0
    num_ooms: 0
    #...
    # more standard cuda memory snapshot data
    reserved_bytes.all.peak: 551550976
    #...
    # host-level memory snapshot data
    rss: 2174173184
    rss_diff: 393216
    rss_post_forward: 2173976576
    rss_pre_forward: 2173583360
    #...
    vms: 19357667328
0.training_step.2.start:
    #...
    active_bytes.all.allocated: 1281527296
    #...
3. Cuda allocator history visualization (generate by dragging the desired *.pickle file to
https://pytorch.org/memory_viz)
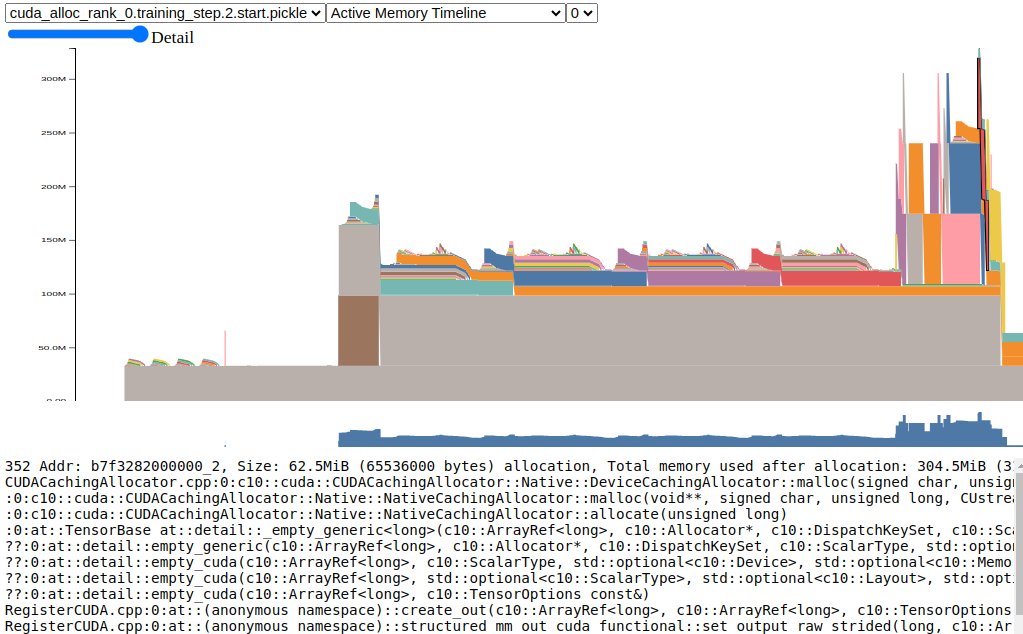
Cuda Allocator History Active Timeline for training_step iteration 2, rank 0, start snapshot
PyTorch Profiler
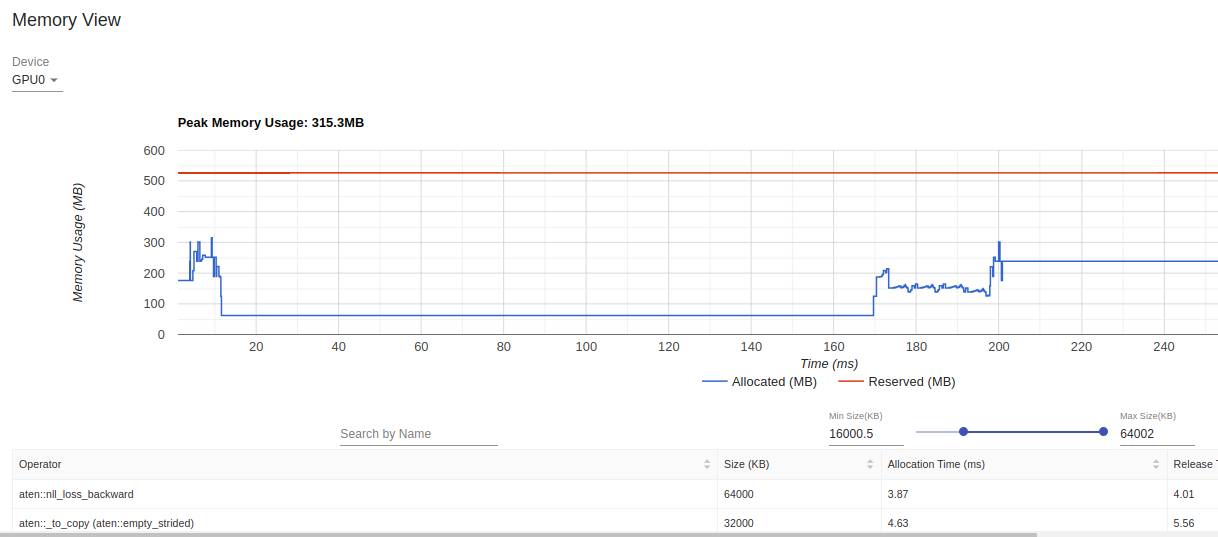
PyTorch profiler tensorboard visualizations

PyTorch profiler textual summary rank 0
